
Arizona Housing Market Report: Q1 2026
Reviewed by Eric Roebuck & Carson Whaley · Updated August 26, 2026
The Q1 2026 numbers for Arizona: prices, sales, pending deals, supply, mortgage rates, and Arizona's largest cities, from FHFA, Realtor.com, Redfin, Freddie Mac, and Zillow data.


You'll work directly with Eric and Carson, the owners, not a call center.
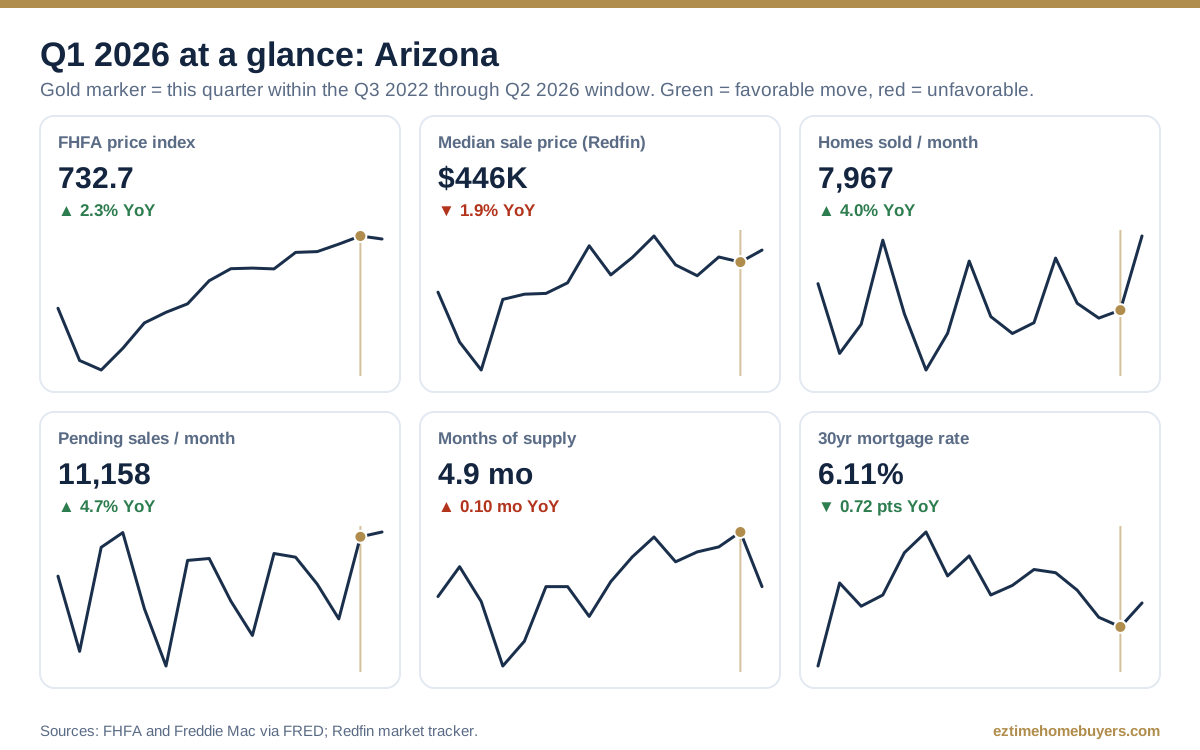
Q1 2026 was another data point in the Arizona housing story, and the numbers are worth pinning down precisely. The FHFA All-Transactions House Price Index came in at 732.7, up a modest 2.3% from a year earlier, one of the cooler readings in this archive, and 0.6% above the prior quarter. The median listing price averaged $472,826 (Realtor.com via FRED), while the median sale price, what buyers actually paid, ran $446,267 per the Redfin market tracker. The 30 year fixed mortgage rate averaged 6.11% for the quarter.
The Numbers This Quarter
| Measure | Q1 2026 | vs prior quarter | vs year earlier |
|---|---|---|---|
| FHFA house price index | 732.7 | ▲ 0.6%vs 728.6 | ▲ 2.3%vs 716.2 |
| Median sale price (Redfin) | $446,267 | ▼ 0.4%vs $447,967 | ▼ 1.9%vs $455,033 |
| Median listing price | $472,826 | ▲ 0.5%vs $470,283 | ▼ 3.2%vs $488,457 |
| Homes sold per month | 7,967 | ▲ 2.5%vs 7,769 | ▲ 4.0%vs 7,657 |
| Pending sales per month | 11,158 | ▲ 28.4%vs 8,688 | ▲ 4.7%vs 10,657 |
| Active listings (avg) | 29,251 | ▲ 1.0%vs 28,963 | ▲ 11.7%vs 26,187 |
| Months of supply | 4.9 mo | ▲ 0.3 movs 4.6 mo | ▲ 0.1 movs 4.8 mo |
| Median days to pending | 72 days | ▲ 4 daysvs 68 days | ▲ 6 daysvs 66 days |
| 30 year mortgage rate (avg) | 6.11% | ▼ 0.12 ptsvs 6.23% | ▼ 0.72 ptsvs 6.83% |
How to read this table
Every marker is colored by what the move means, not just its direction: falling mortgage rates, supply, and days to pending read as green because they favor a sale. The small figure under each marker is the baseline the change is measured against. Listing prices and inventory are strongly seasonal, so the year over year column is the meaningful comparison.
Sales and Supply: Did Homes Actually Move?
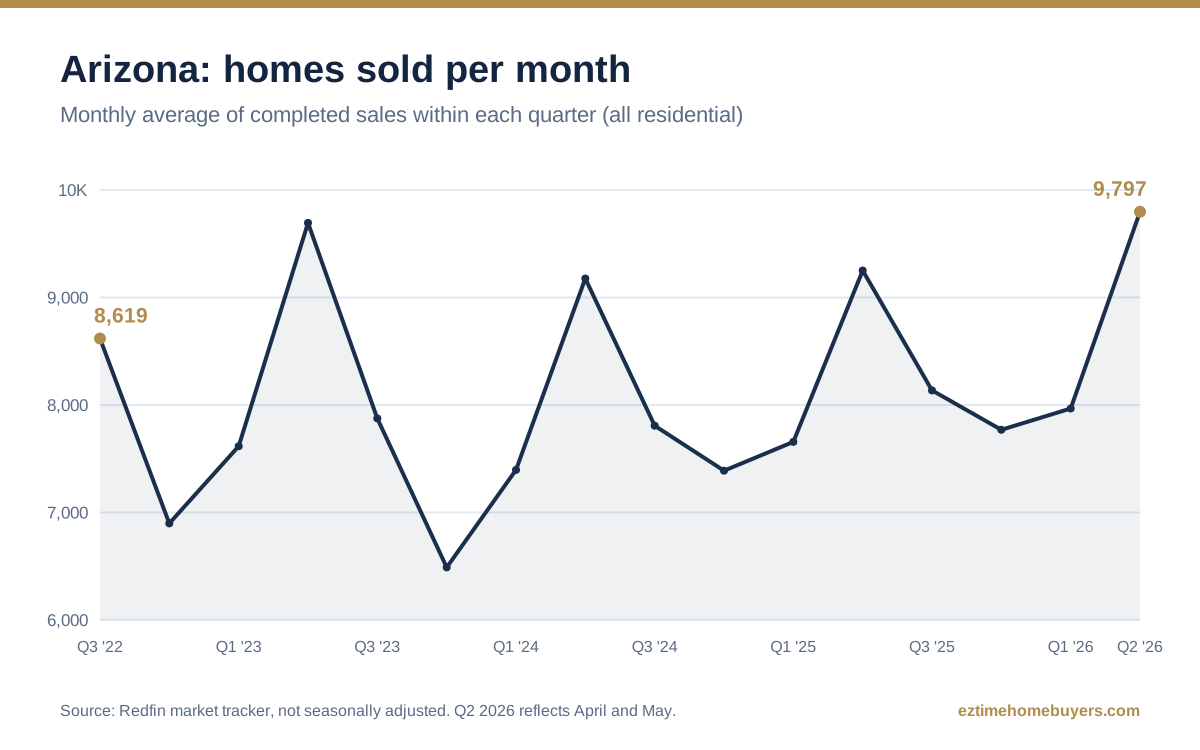
Completed sales averaged 7,967 homes a month in Q1 2026 (up 4% against the same months a year earlier), with pending sales, the deals going under contract, running 11,158 a month. At that pace the market held 4.9 months of supply, balanced-market territory by the common rule of thumb, and the typical home that sold went under contract in 72 days.
City Check: Arizona's Largest Cities in Q1 2026
Typical home values from the Zillow Home Value Index (ZHVI), city proper rather than metro, with movement markers and the baseline each change is measured against:
| City | Typical home value (Q1 2026) | vs prior quarter | vs year earlier |
|---|---|---|---|
| Phoenix | $413,936 | ▲ 0.3%vs $412,698 | ▼ 3.2%vs $427,620 |
| Tucson | $327,029 | ◆ 0.0%vs $327,029 | ▼ 2.4%vs $335,071 |
| Mesa | $437,668 | ▲ 0.5%vs $435,491 | ▼ 2.4%vs $448,430 |
| Chandler | $526,551 | ▲ 0.3%vs $524,976 | ▼ 2.4%vs $539,499 |
| Scottsdale | $849,746 | ▲ 1.6%vs $836,364 | ▲ 1.2%vs $839,670 |
Scottsdale led the five in Q1 2026 at 1.2% year over year; Phoenix trailed at -3.2%.
How Q1 2026 Fits the Bigger Picture
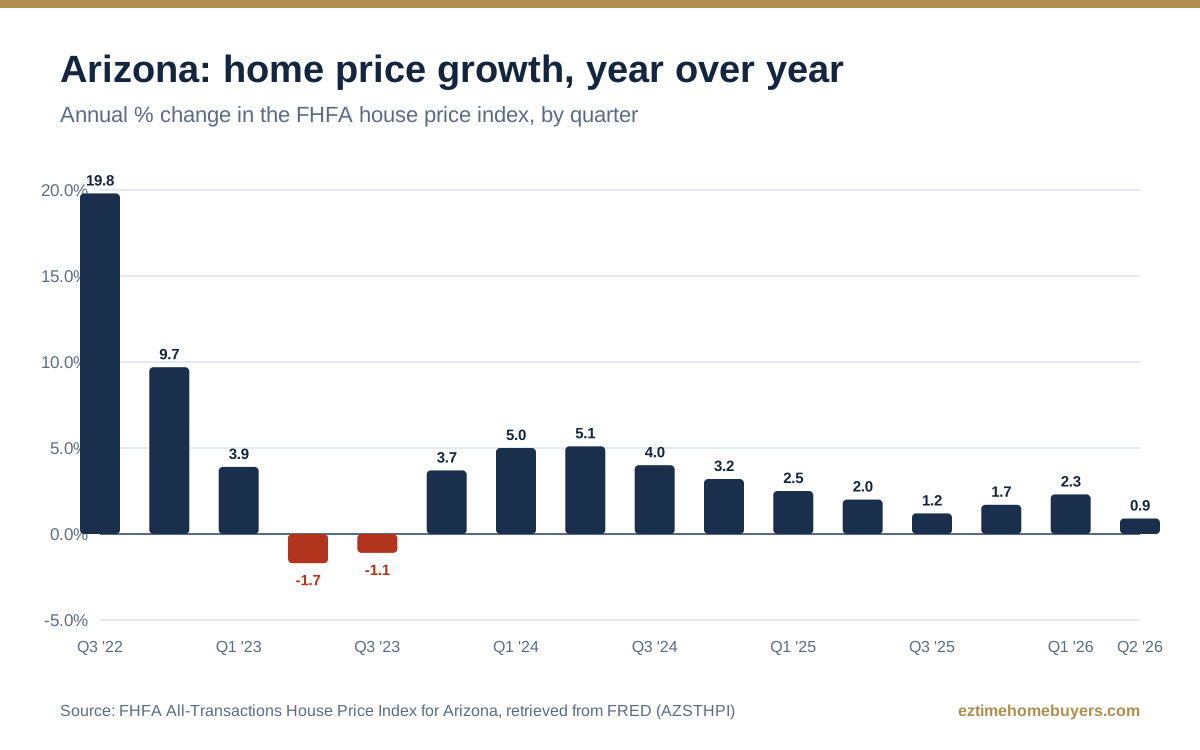
Annual price growth of 2.3% ranked 10th hottest of the 15 quarters tracked to this point. Our Arizona housing market analysis charts all 16 quarters together, or step through the archive: Q4 2025 report · Q2 2026 report.
If these numbers have you weighing a sale, our Arizona page explains how a written, math-shown cash offer works, and the full market analysis puts this quarter in context.
About This Data
- Price index: FHFA All-Transactions House Price Index (AZSTHPI), retrieved from FRED.
- Listing price and inventory: Realtor.com data via FRED; monthly values averaged to the quarter.
- Sales, pending sales, months of supply, and days to pending: Redfin market tracker, all residential, not seasonally adjusted; transaction counts shown as monthly averages within the quarter.
- Mortgage rate: Freddie Mac 30 Year Fixed Rate Mortgage Average (MORTGAGE30US), quarterly average of weekly values.
- City values: Zillow Home Value Index (ZHVI), all homes, smoothed and seasonally adjusted, city level.
- Published August 2026 as part of a 16 quarter archive (Q3 2022 through Q2 2026). Data retrieved August 26, 2026. Historical reporting, not a forecast or investment advice.
The EZ Time Standard
Six promises we make on every transaction, in every market. Not marketing lines, operating policy.
Every offer in writing, math included
The after-repair value, repair estimate, and our margin, line by line. If a number moves, you see why.
Both options in one conversation
The fast cash offer and the Retail Buyer Program number, side by side, so the trade-off is concrete before you decide anything.
No fees or commissions, either path
Your number is your number. Typical seller closing costs are on us, and nothing is deducted later.
Licensed title company closings, always
Funds and documents go through a neutral title company or closing attorney on every transaction. No exceptions.
No pressure, by policy
Our offers don't expire in 24 hours, and "let me think about it" is a perfectly good answer. Take the offer to your attorney.
Straight answers about our role
If a vetted local partner will be the closing buyer on your property rather than us directly, you'll know before you sign anything.
These promises have names attached. Meet Eric and Carson, the people who answer when you call.
Related Guides
Ready to see both of your numbers?
Tell us about your property once and get a written cash offer, plus what our Retail Buyer Program could net you instead. No repairs, no fees, no pressure to accept.