
Ohio Housing Market Analysis: The Last 16 Quarters in Data
Reviewed by Eric Roebuck & Carson Whaley · Updated August 26, 2026
A quarter-by-quarter look at Ohio home prices, listing prices, and inventory from Q3 2022 through Q2 2026. Every figure comes from FHFA, Realtor.com, and Freddie Mac data retrieved through FRED on August 26, 2026.


You'll work directly with Eric and Carson, the owners, not a call center.
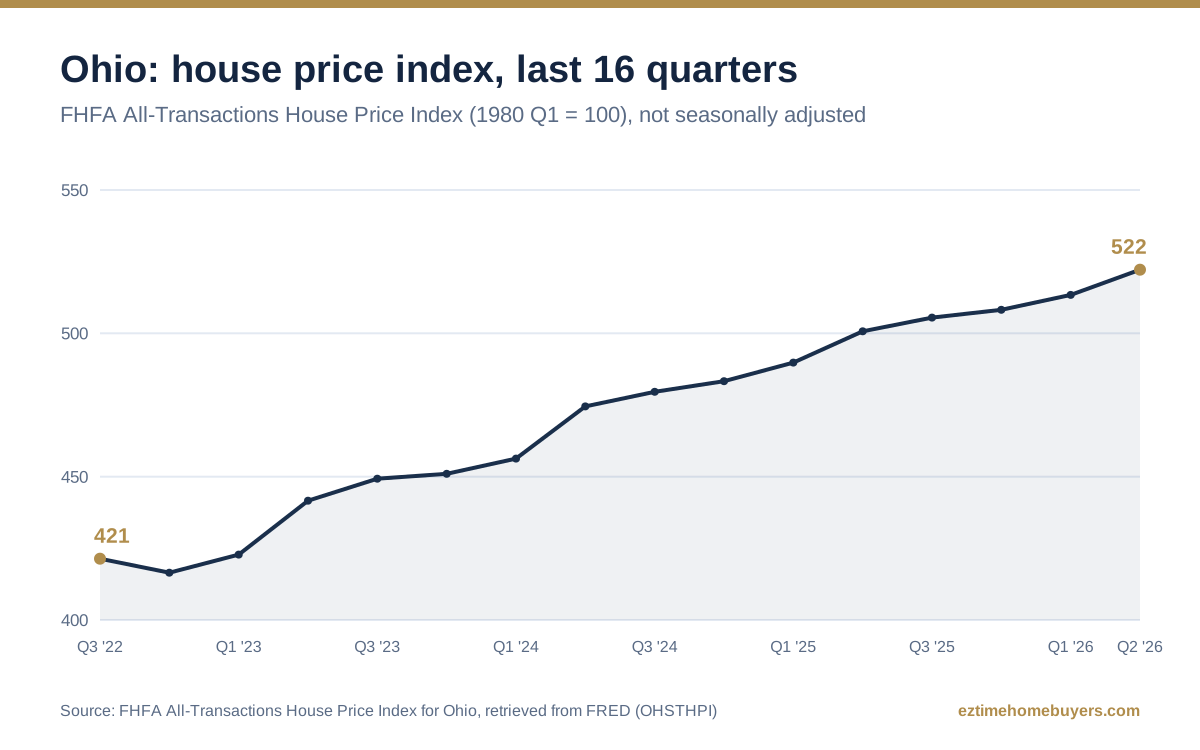
Ohio home prices rose 23.9% over the 16 quarters from Q3 2022 through Q2 2026, according to the FHFA All-Transactions House Price Index for Ohio. Appreciation has slowed, not reversed: the index posted a 4.3% year-over-year gain in Q2 2026, the smallest of the window, but it never once went negative. The statewide median listing price averaged $289,783 in Q2 2026, the highest quarterly reading of the entire period, per Realtor.com median listing price data retrieved through FRED, and active listing counts averaged 18,784, up 18% from where the window began. Prices are still climbing while inventory quietly rebuilds. That tension is the story of the current Ohio market, and the numbers below lay it out quarter by quarter.
How Ohio Home Prices Have Moved
The FHFA index for Ohio stood at 421.4 in Q3 2022 and finished at 522.2 in Q2 2026. The climb was not perfectly smooth. The index slipped to 416.5 in Q4 2022, the only quarter in the window where it fell, right as the 30-year mortgage rate averaged 6.66% after sitting at 5.62% just one quarter earlier. It recovered to 422.8 in Q1 2023 and never looked back, crossing 500 for the first time in Q2 2025 at 500.7.
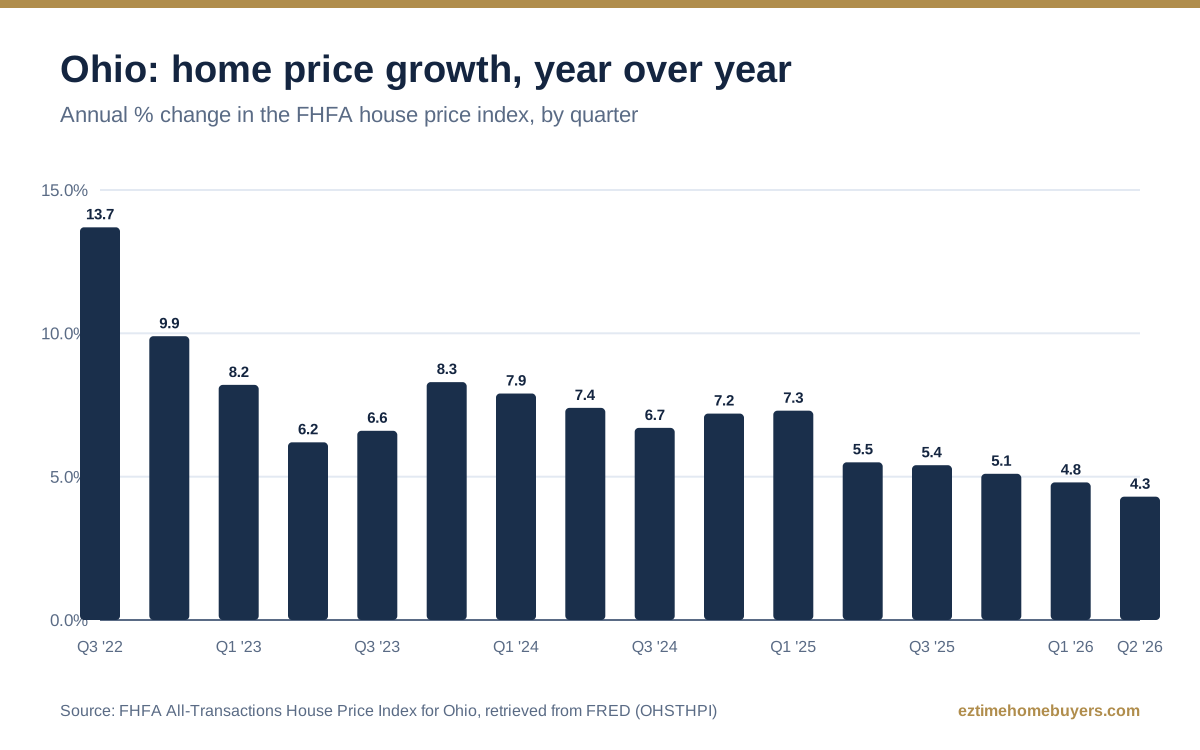
The growth rate tells a cleaner story. Year-over-year appreciation peaked at 13.7% in Q3 2022, the tail end of the pandemic-era run. It decelerated hard to 6.2% by Q2 2023, then did something unusual: it re-accelerated, hitting 8.3% in Q4 2023 and holding between 6.7% and 7.9% through Q1 2025. Ohio stayed warm while much of the country cooled. The real slowdown arrived in mid-2025. YoY growth stepped down to 5.5% in Q2 2025, then 5.4%, 5.1%, 4.8%, and finally 4.3% in Q2 2026. That is five straight quarters of deceleration, and still no negative print anywhere in the window.
What Homes Are Listed For
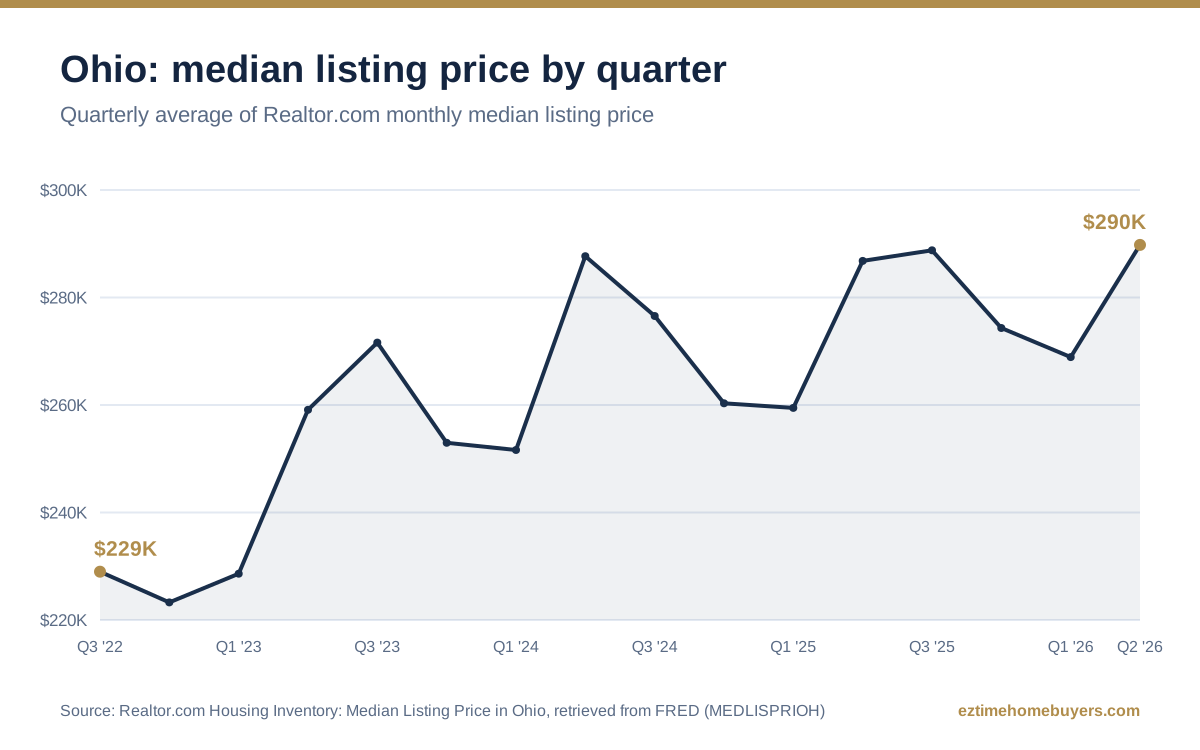
Asking prices followed a seasonal sawtooth: up in spring and summer, down in fall and winter. Q3 2022's median list price of $228,983 now looks like a different market. Q1 2023 posted the fastest list-price growth of the window at 18.9% year over year, and by Q3 2023 the median reached $271,617, up 18.6%. Then the sticker shock caught up. List-price growth fell to 1.8% YoY by Q3 2024, and Q2 2025 printed the only negative reading, a 0.3% dip against Q2 2024's $287,687.
Here is the notable part: the peak of the whole window is the most recent quarter. The Q2 2026 median of $289,783 edged past every prior spring market, and the single month of July 2026 came in at $294,950, so asking prices were still rising into the summer. Growth of 1.0% YoY is modest, but sellers are listing at higher numbers than at any point in the last four years.
How Many Homes Are on the Market
Inventory is where this market has genuinely changed. Active listings averaged 15,916 in Q3 2022, then collapsed to a window low of 11,271 in Q1 2023 as owners holding cheap mortgages stayed put. Q3 2023 was still down 14.4% year over year. Since then the direction has been one way: up. Q3 2024 jumped 27.7% YoY to 17,405 listings, Q2 2025 rose 29.9%, and Q4 2025 set the window high at 21,425. Q2 2026 averaged 18,784 active listings, 18% above the start of the window, and July 2026 alone counted 22,165. That makes eight consecutive quarters of double-digit YoY inventory growth.
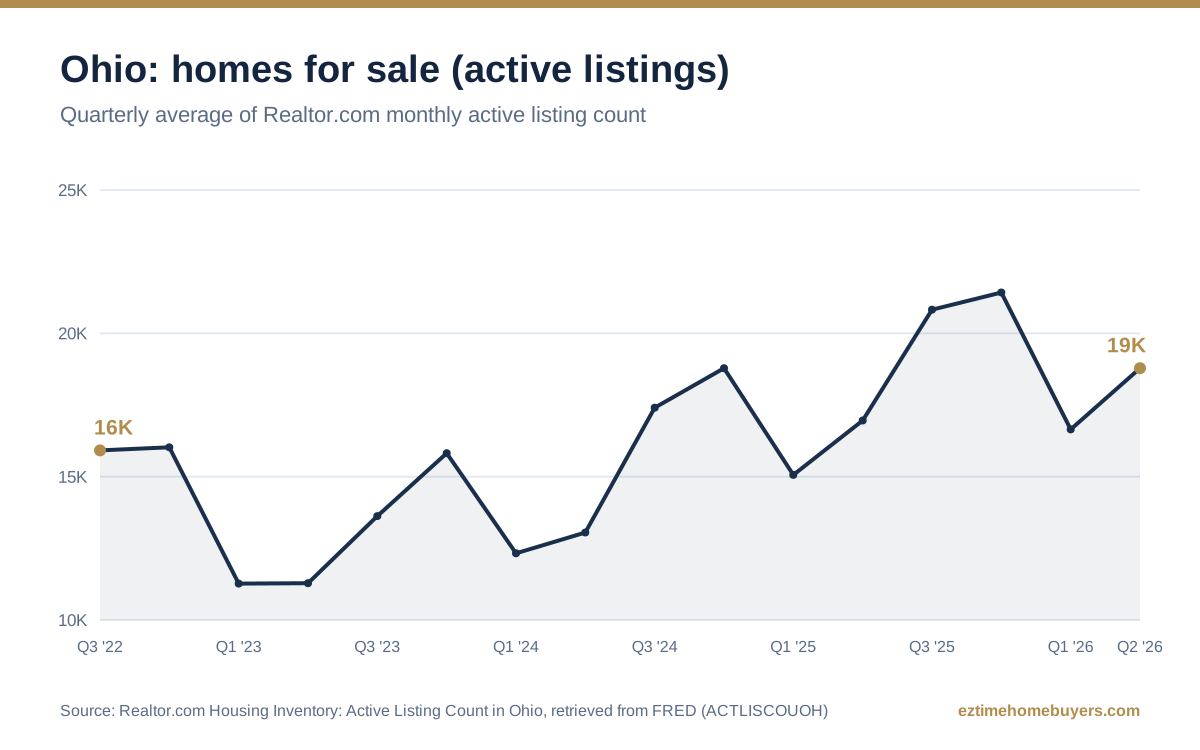
What does that mean if you own a house here? More listings means buyers have more choices, and each individual listing gets a smaller slice of buyer attention. When barely 11,000 homes were on the market statewide, buyers competed for whatever was available. With more than 18,000, they can afford to skip the house with the dated kitchen or the roof question. Prices have not fallen, but the leverage a seller had in 2023 has thinned, and the data shows it thinning quarter after quarter.
What Homes Are Worth in Ohio's Largest Cities
Statewide numbers hide a lot of variation, so here is the same window at street level. The table shows the Zillow Home Value Index (ZHVI), a smoothed, seasonally adjusted estimate of the typical home value in the city proper (not the wider metro area), for Ohio's five largest cities as of Q2 2026, with the baseline each change is measured against.
| City | Typical home value (Q2 2026) | vs prior quarter | vs year earlier | Since Q3 2022 |
|---|---|---|---|---|
| Columbus | $250,053 | ▼ 0.5%vs $251,310 | ▼ 0.7%vs $251,816 | ▲ 7.3%vs $233,053 |
| Cleveland | $117,421 | ▼ 0.5%vs $118,011 | ▼ 2.1%vs $119,940 | ▲ 7.6%vs $109,094 |
| Cincinnati | $253,367 | ◆ 0.0%vs $253,367 | ▲ 1.4%vs $249,869 | ▲ 12.0%vs $226,132 |
| Toledo | $133,655 | ▲ 0.3%vs $133,255 | ▲ 5.2%vs $127,048 | ▲ 20.4%vs $111,015 |
| Akron | $142,052 | ▲ 0.7%vs $141,065 | ▲ 3.0%vs $137,915 | ▲ 17.5%vs $120,911 |
Toledo is the strongest of the five right now, with typical values up 5.2% year over year. Cleveland sits at the other end at -2.1%. The quarter-by-quarter city numbers, with the same up and down markers, are in the quarterly reports listed further down this page.
Sales, Supply, and Pending Deals
Prices tell you what homes are worth; transactions tell you whether anything is actually moving. Per the Redfin market tracker (all residential, not seasonally adjusted), completed sales in Ohio averaged 11,638 homes a month in Q2 2026 (down 1.6% from the same months a year earlier), with pending sales running 15,349 a month. The median sale price, what buyers actually paid, averaged $278,150, up 6.7% year over year. At the current sales pace the market holds 2.5 months of supply, which by the common rule of thumb is seller's market territory, and the typical home that sold went under contract in 38 days. Redfin figures for Q2 2026 reflect April and May, the months reported so far; year over year comparisons use the same months a year earlier.
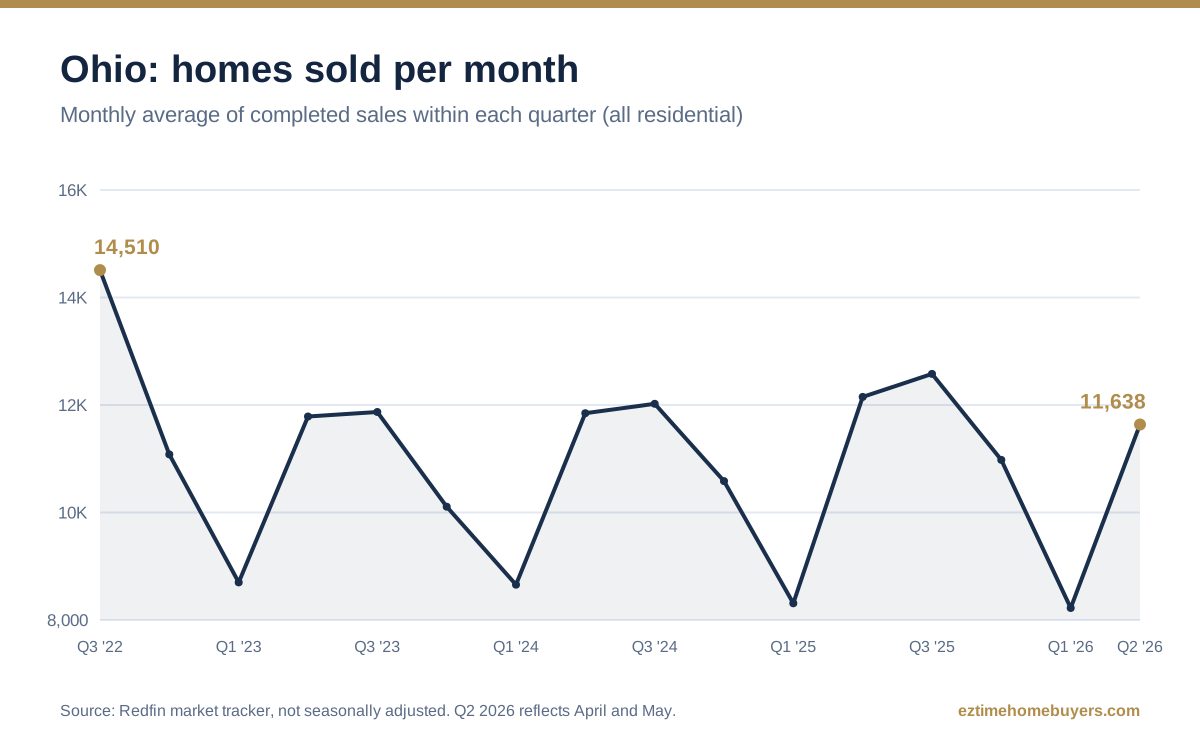
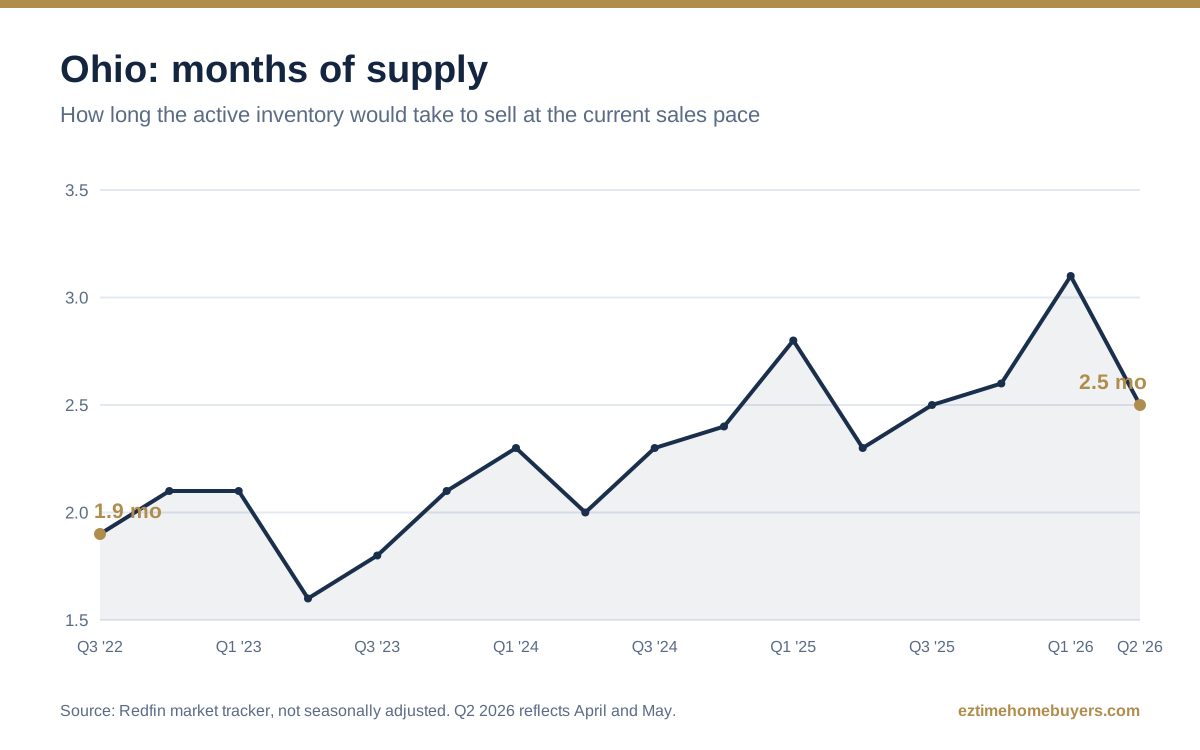
| Quarter | Median sale price | Homes sold / mo | Pending sales / mo | Months of supply | Median days to pending |
|---|---|---|---|---|---|
| Q3 2025 | $269,467 ▲ 4.7%vs $257,371 | 12,579 ▲ 4.6%vs 12,023 | 14,461 ▼ 1.5%vs 14,687 | 2.5 ▲ 0.2 movs 2.3 | 38 ▲ 3 daysvs 35 days |
| Q4 2025 | $260,200 ▲ 5.3%vs $247,104 | 10,979 ▲ 3.7%vs 10,584 | 11,251 ▼ 5.0%vs 11,845 | 2.6 ▲ 0.2 movs 2.4 | 45 ▲ 4 daysvs 41 days |
| Q1 2026 | $253,500 ▲ 5.2%vs $240,970 | 8,223 ▼ 1.1%vs 8,311 | 11,783 ▲ 0.5%vs 11,721 | 3.1 ▲ 0.3 movs 2.8 | 55 ▲ 4 daysvs 50 days |
| Q2 2026* | $278,150 ▲ 6.7%vs $260,684 | 11,638 ▼ 1.6%vs 11,828 | 15,349 ▲ 3.5%vs 14,827 | 2.5 ▲ 0.2 movs 2.3 | 38 ▲ 1 daysvs 37 days |
*Partial quarter; see the note above. All change markers compare against the year-earlier baseline shown beneath them.
The Numbers, Quarter by Quarter
| Quarter | FHFA price index | Price growth YoY | Median listing price | Active listings |
|---|---|---|---|---|
| Q3 2022 | 421.4 | 13.7% | $228,983 | 15,916 |
| Q4 2022 | 416.5 | 9.9% | $223,283 | 16,023 |
| Q1 2023 | 422.8 | 8.2% | $228,617 | 11,271 |
| Q2 2023 | 441.6 | 6.2% | $259,115 | 11,283 |
| Q3 2023 | 449.3 | 6.6% | $271,617 | 13,625 |
| Q4 2023 | 451.0 | 8.3% | $252,967 | 15,817 |
| Q1 2024 | 456.3 | 7.9% | $251,633 | 12,327 |
| Q2 2024 | 474.5 | 7.4% | $287,687 | 13,053 |
| Q3 2024 | 479.6 | 6.7% | $276,550 | 17,405 |
| Q4 2024 | 483.3 | 7.2% | $260,317 | 18,785 |
| Q1 2025 | 489.8 | 7.3% | $259,467 | 15,061 |
| Q2 2025 | 500.7 | 5.5% | $286,808 | 16,959 |
| Q3 2025 | 505.5 | 5.4% | $288,783 | 20,825 |
| Q4 2025 | 508.2 | 5.1% | $274,333 | 21,425 |
| Q1 2026 | 513.4 | 4.8% | $268,917 | 16,650 |
| Q2 2026 | 522.2 | 4.3% | $289,783 | 18,784 |
What This Means If You're Selling
The equity you built is real
The 23.9% index gain since Q3 2022 landed on top of a market that was already growing 13.7% a year when the window opened. If you bought before 2022, a meaningful share of your home's current value is appreciation you never paid for. That cushion is what gives you options: list it, sell it directly, or put money into repairs first. Compared with the national market, Ohio's price growth has held up on the stronger end, which helps explain why demand here never fully stalled even with mortgage rates averaging 6.41% in Q2 2026.
More inventory means longer, pickier sales
Eight straight quarters of double-digit inventory growth changes the experience of listing a home. Your competition in Q2 2026 was 18,784 other active listings, not the 11,283 of Q2 2023. Homes in strong condition still move. Homes with problems sit, collect price reductions, and get shopped against fresher listings every week. If your house needs work, be honest with yourself about which pool it will land in; we wrote a full guide on selling a house that needs repairs for exactly that situation.
Condition decides which buyers show up
At a 6.41% average mortgage rate, financed buyers are stretched on the payment, so they gravitate toward move-in-ready homes and negotiate hard on everything else. Houses that are dated, damaged, or inherited with decades of deferred maintenance increasingly sell to direct buyers instead. That is where we operate. EZ Time Home Buyers makes written as-is cash offers within 24 hours everywhere shown on our Ohio page, with no fees and closings in 2-3 weeks. If your house is in good shape but you want certainty without the listing circus, our Retail Buyer Program typically nets more than a typical cash offer. Either way, the takeaway from 16 quarters of data is simple: know your equity, know your competition, and pick the selling path that fits the house you actually have.
Quarterly Market Reports
Every quarter in this analysis has its own report page with that quarter's index reading, listing data, mortgage rate, and city values, including the quarters where the story was very different from today's:
Data and Methodology
- Price index: FHFA All-Transactions House Price Index for Ohio (OHSTHPI), retrieved from FRED.
- Median listing price: Realtor.com Housing Inventory: Median Listing Price in Ohio (MEDLISPRIOH), retrieved from FRED.
- Active listings: Realtor.com Housing Inventory: Active Listing Count in Ohio (ACTLISCOUOH), retrieved from FRED.
- Mortgage rate context: Freddie Mac 30-Year Fixed Rate Mortgage Average (MORTGAGE30US), retrieved from FRED.
- City home values: Zillow Home Value Index (ZHVI), all homes, smoothed and seasonally adjusted, city level, retrieved August 26, 2026.
- Sales, pending sales, months of supply, and days on market: Redfin market tracker (monthly, all residential, not seasonally adjusted); transaction counts shown as monthly averages within each quarter, retrieved August 26, 2026.
- Sales, pending sales, months of supply, and days on market: Redfin market tracker (monthly, all residential, not seasonally adjusted); transaction counts shown as monthly averages within each quarter, retrieved August 26, 2026.
- Monthly series are averaged to calendar quarters.
- Data retrieved August 26, 2026. This page reports historical data; it is not a price forecast or investment advice.
Frequently Asked Questions
Are Ohio home prices falling?
No. The FHFA All-Transactions House Price Index for Ohio was up 4.3% year over year in Q2 2026. Growth has slowed for five straight quarters, down from a peak of 13.7% in Q3 2022, but the index never posted a negative year-over-year reading in the last 16 quarters. Median listing prices tell a similar story: the Q2 2026 figure of $289,783 was the highest of the entire window, though only 1.0% above a year earlier.
Is Ohio a buyer's market or a seller's market right now?
The data sits in between, with the balance shifting. Active listings have grown by double digits year over year for eight straight quarters, reaching 18,784 in Q2 2026 versus a low of 11,271 in Q1 2023, so buyers have more choices than at any point since 2022. At the same time, prices are still rising and the median listing price hit its 16-quarter peak in Q2 2026. More inventory chips away at seller leverage, but the numbers do not show sellers being forced to cut.
How much have Ohio home prices gone up since 2022?
23.9% over the 16 quarters from Q3 2022 through Q2 2026, based on the FHFA All-Transactions House Price Index for Ohio, which rose from 421.4 to 522.2. Asking prices moved in the same direction: the statewide median listing price went from $228,983 in Q3 2022 to $289,783 in Q2 2026.
Where does this housing market data come from?
Every number on this page comes from public data retrieved through FRED on August 26, 2026: the FHFA All-Transactions House Price Index for Ohio (OHSTHPI), Realtor.com's median listing price and active listing count series for Ohio (MEDLISPRIOH and ACTLISCOUOH), and the Freddie Mac 30-Year Fixed Rate Mortgage Average (MORTGAGE30US). Monthly series are averaged to calendar quarters.
The EZ Time Standard
Six promises we make on every transaction, in every market. Not marketing lines, operating policy.
Every offer in writing, math included
The after-repair value, repair estimate, and our margin, line by line. If a number moves, you see why.
Both options in one conversation
The fast cash offer and the Retail Buyer Program number, side by side, so the trade-off is concrete before you decide anything.
No fees or commissions, either path
Your number is your number. Typical seller closing costs are on us, and nothing is deducted later.
Licensed title company closings, always
Funds and documents go through a neutral title company or closing attorney on every transaction. No exceptions.
No pressure, by policy
Our offers don't expire in 24 hours, and "let me think about it" is a perfectly good answer. Take the offer to your attorney.
Straight answers about our role
If a vetted local partner will be the closing buyer on your property rather than us directly, you'll know before you sign anything.
These promises have names attached. Meet Eric and Carson, the people who answer when you call.
Related Guides
Ready to see both of your numbers?
Tell us about your property once and get a written cash offer, plus what our Retail Buyer Program could net you instead. No repairs, no fees, no pressure to accept.